Housing Market Update April 2020

Joe Muck
As an entrepreneur and former co-owner of a successful residential moving company, Joe understands the importance of attention to detail and the art o...
As an entrepreneur and former co-owner of a successful residential moving company, Joe understands the importance of attention to detail and the art o...
Over 90% of the country is in some form of Stay Home order. Each state operates a bit differently in who or what is essential and how they handle repercussions of breaking those rules. One thing for sure is that millions of Americans have been unable to work in their standard capacity. Unemployment claims are at an all time high. The stock market went from the fastest decline since 1931 to the fastest increase since 1938. Overall, the economy today is not what it was even a month ago. Technically, a recession requires two quarters of declining GDP. But even the best economists know that's not a practical definition any more. Whether we ARE in a recession, ENTERING a recession or just missing a recession, the economy needs to recover. What indicators show housing may not be negatively impacted and more importantly what makes this recession different from 2008 in terms of a housing crisis? Much of the following information came from Keeping Current Matters.
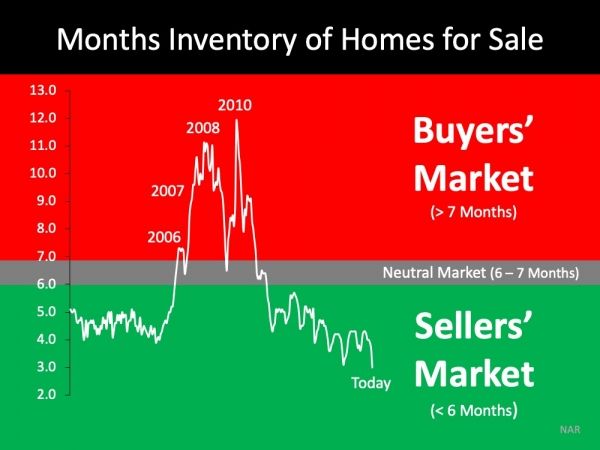
1) Housing Inventory
A Seller's Market - when the seller has the power due to a lack of inventory - traditionally means that if ALL home sales stopped on a day, it would take roughly 6-7 months for every home to sell. It also means if you list a home, it's likely to sell in under 6 months. As you can see by the graph provided by National Association of Realtors (NAR), leading into the previous recession, there was an abundance of inventory. We were deep into a Buyer's Market. One where there is so much inventory available (so many homes for sale) that buyers held the negotiating power. Over the last handful of years, there were so many homes to choose from. If you didn't take their offer they could move on to a similar home down the street that would take their offer. The fact remains there was not enough inventory to handle buyer's needs as of just a month ago. While turbulent times are likely ahead, it is highly unlikely we will go from 1-3 month's inventory to over 1 year's worth of inventory.
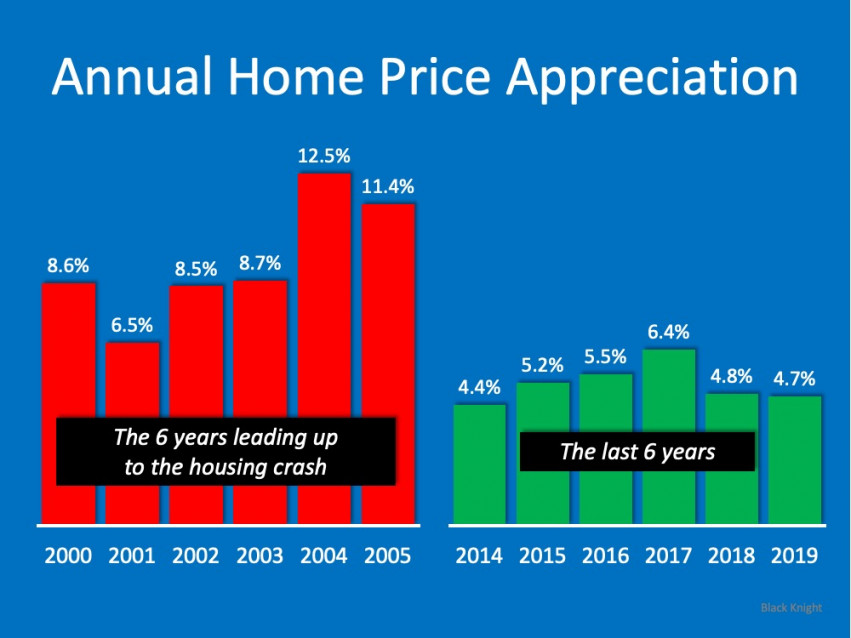
2) Housing Appreciation
Yes, many nay-sayers have used phrases like inflated values for quite some time. The truth is, many of the people that believe house values have been inflated have said so since 2013. Similarly, they've predicted the housing market crash since that time as well. So far, 6+ years later, they're wrong. Looking at the graphic to the right, you see that values were far more inflated leading up to 2006-2010 when the market crashed. These are national numbers, but the market's stability is a national occurrence. While some areas such as San Francisco or Seattle and locally like Macomb Township and South Lyon have seen much greater appreciation than these numbers, overall we are all supported by each other in the housing market.
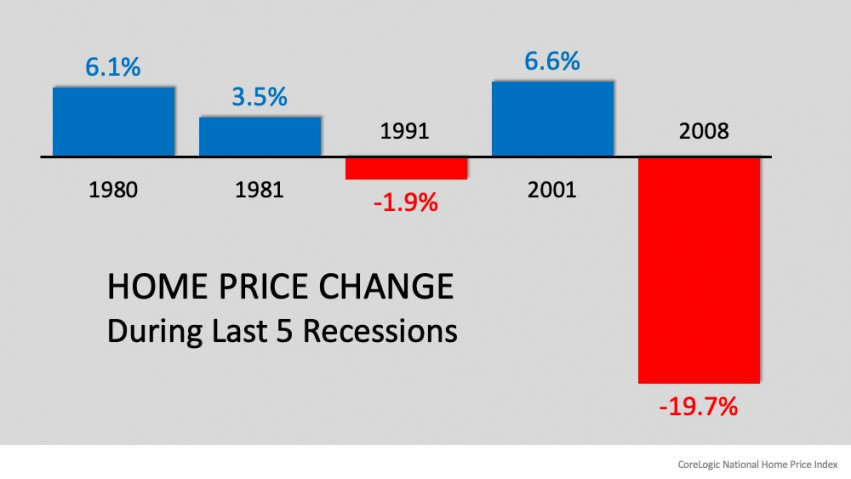
3) Historical Data
According to Corelogic, a study of information from Freddie Mac (1975-2018) home values only dipped in 2 of the last recessions. The Gulf War recession shows that even in that dip, we only saw about a 2% decrease in home values. That leaves only the Great Recession as the time house values truly decreased during the last 5 recessions and going back to 1980.
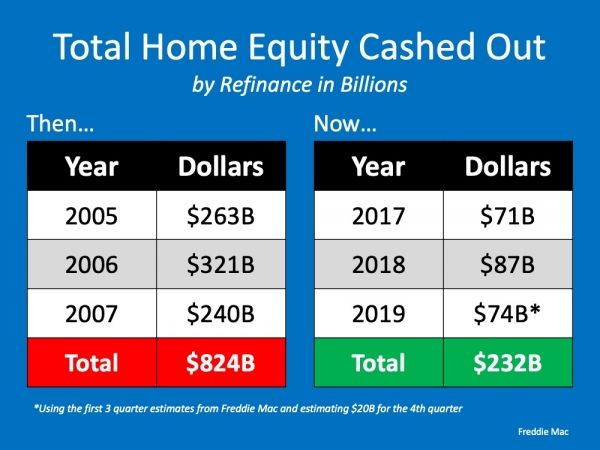
4) Equity Then vs Now
In 2008, Americans were utilizing equity in their home to pay for other debt. Cash-out refinance happened at record setting numbers. In the years 2005, 2006 & 2007, Americans cashed out $824 billion in equity. That is $824,000,000,000 in cash removed from home values leaving very little equity in our marketplace by 2008. With homes maxed out at 100%, even a 1% drop in value puts you upside down. As we saw earlier, we dropped much more than that and caused a major foreclosure and short sale market. Today, over half of our homes have at least 50% equity in their home. This number comes from the 37% of homes that have no mortgage and the fact that almost 27% of homes with a mortgage have a mortgage at 50% of it's value or less. As you can see from the graphic, our recent three year total was less than any one year leading to the market crash.
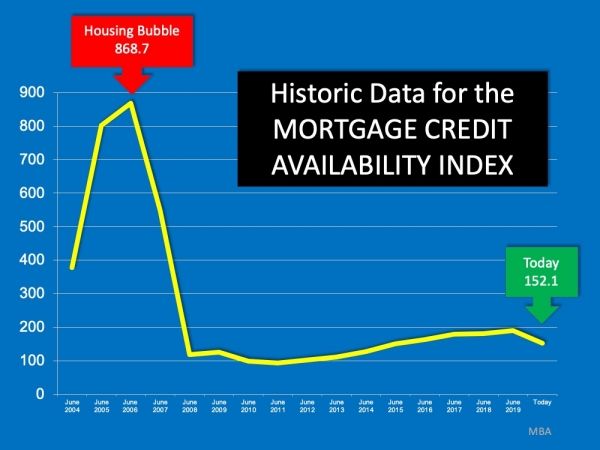
5) Mortgage Credit Availability
This index shows the level of difficulty to obtain a mortgage. It's an inverse table, meaning the higher the number the easier it is to get a mortgage. Talk to a lender or a borrower from the mid-2000s and you'll quickly learn almost anybody could get a mortgage. Things like No Income No Asset loans, Stated Income loans and a huge sub-prime mortgage market made it available for people with 480 FICO scores to sometimes obtain mortgages as well as people without verifiable income. One thing not shown here was that many of those loans were NOT fixed rates. So your payment would increase over time. In addition to having a variable rate, a large portion of loans also were not requiring borrowers to pay down principal. While it has been harder to get a loan from 2010-2020 than it was 2000-2010, lenders are creating tougher guidelines as we enter unstable water. In the mid-2000s, they were easing rules and regulations even as we entered a foreclosure market.
Analysis
It would be foolish to suggest our values are set to skyrocket sometime soon. If you have a home listed right now, it's likely to sell. With stay at home orders, we have seen a drastic dip in purchase contracts. Locally in Michigan, the only way you can enter a contract is without actually stepping foot in the home. YouTube videos and 3D Matterport tours are helpful. They've been a part of our marketing strategy for sellers for years. However, they will never replace actually walking through a home in person. The majority of sight unseen purchases are likely people with a pressing need or desire to purchase such as lease term ending, family size changing, job change, etc. Undoubtedly, a change is set to come. While the outlook is not the bright one we had a handful of months ago, it is also far from the bleak outlook we had or witnessed around 2008.
Selling Your Home?
Get your home's value - our custom reports include accurate and up to date information.